Our insights
Discover health and wellness trends, insights and ideas to inspire better marketing for your brand.

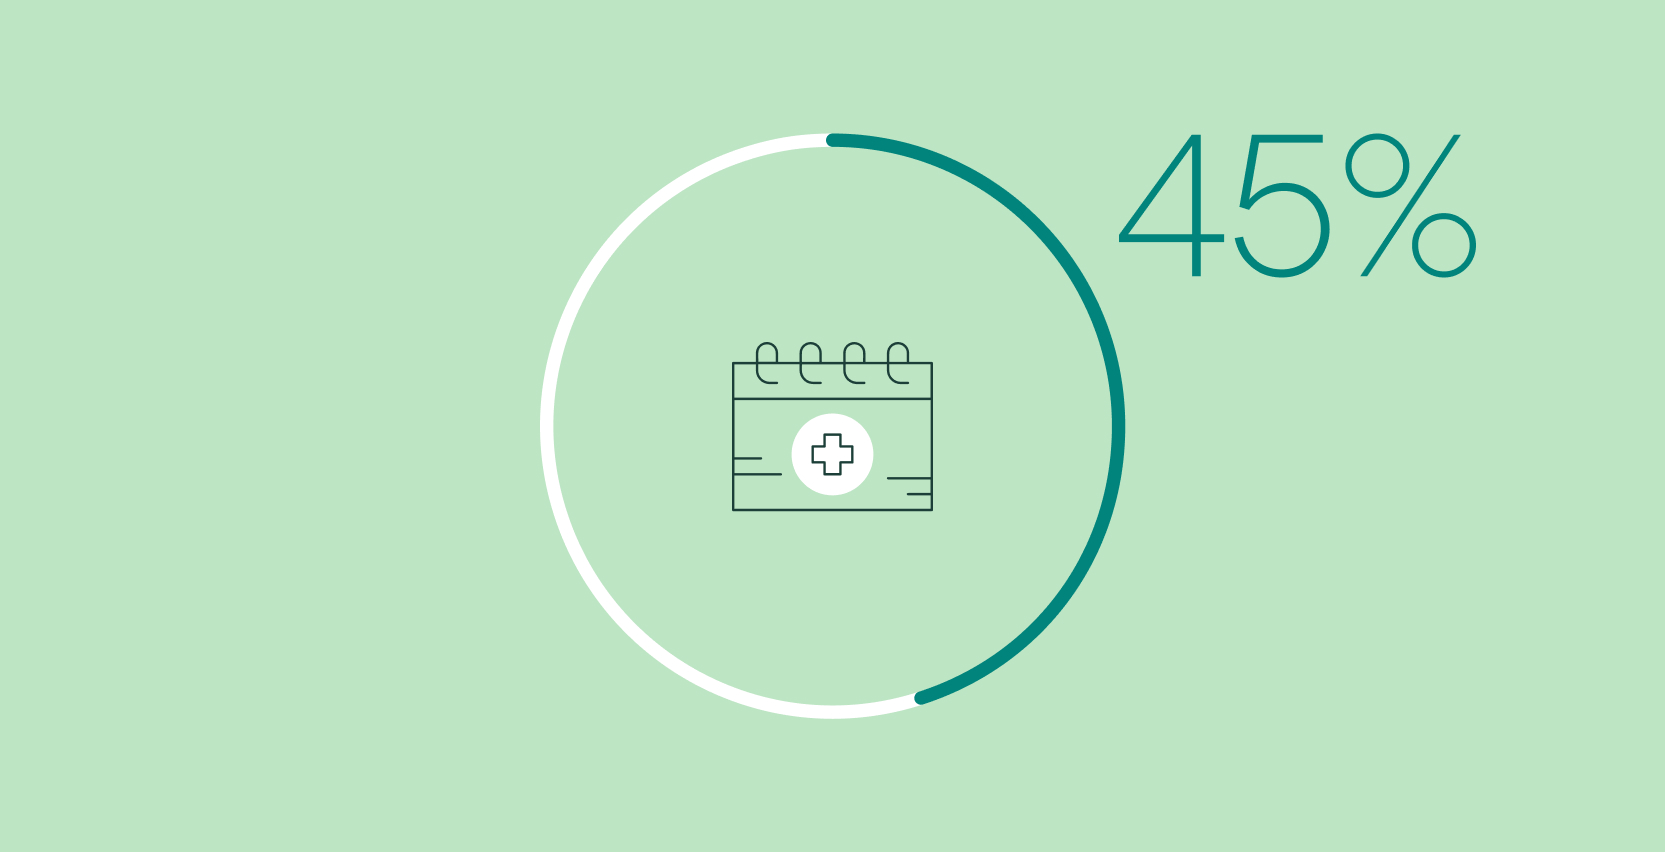
Discover what HCPs are looking for when it comes to drug information and pharma-owned websites.
Read moreNew digital innovations are creating more opportunities than ever before to move us closer to health equity.
Read moreEverybody’s Insights Director shares the three must-haves for identifying what your audience wants.
Read moreWhat should pharma and healthcare marketers be paying attention to this year?
Read moreDid you know only 12% of people trust pharma companies to keep their digital healthcare info secure? Get insights on healthcare trends that matter.
Read moreIn the age of infographics, we owe a lot to the man who pioneered the way we look at data.
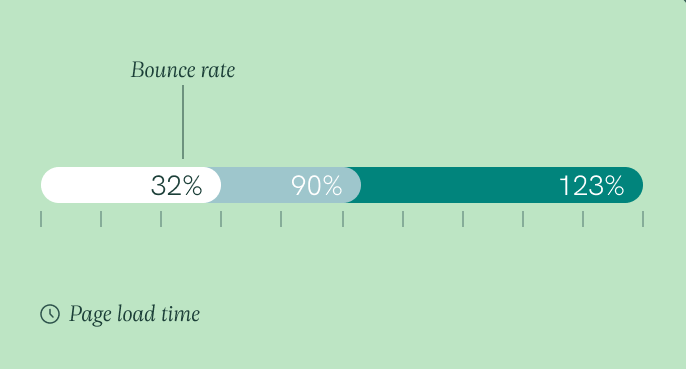
Read moreMeet our tool making it easy to monitor page speed performance.
Read moreFind out how dashboards can help your team make better decisions and save time.
Read moreJoin our CEO Ben Myall to discover the key concepts of behavioral science and what we can learn from it to create meaningful interactions with our audiences.
Read more